Data Management and Statistics Core (DMS)
Overview
The Data Management and Statistics Core (DM&SC) is one of 4 Cores supporting the scientific research activities of the ISAVRAD Program Projects and is responsible for management, reporting and sharing of raw and meta-data generated by the Clinical and Neuroimaging Cores; from NIA ADSP components (NCRAD, NIAGADS and GCAD); and from ISAVRAD Projects, to allow completion of the proposed aims and foster collaboration within and outside the ISAVRAD network. Led by the two Informatics and Statistics Core leaders for the South Texas Alzheimer’s Center, the DM&SC is equipped with advanced informatics, data management, and statistical infrastructure and expertise to meet these specialized needs.
Participating Institutions
- UT Health SA
Aim 1
Align ISAVRAD data with appropriate standards to maximize data reuse, including the ADCs UDS, the WHO Clinical Characterization CRF, relevant controlled terminology and other data standards.
Aim 2
Provide information systems and expert support for data and sample collection and management. ISAVRAD clinical data include medical history, SARS-CoV-2 infection, neurological and neuropsychological evaluations, neuroimaging, and biomarkers.
Aim 3
Provide information systems and expert support for data and sample collection and management. ISAVRAD clinical data include medical history, SARS-CoV-2 infection, neurological and neuropsychological evaluations, neuroimaging, and biomarkers.
Core Leadership
- Dr. Meredith Zozus – Core Co-PI - UT Health San Antonio
- Dr. Chen-Pin Wang – Core Co-PI - UT Health San Antonio
- Dr. Jayandra Himali – UT Health San Antonio
- Bill Sanns, BGS – UT Health San Antonio
Data and Resource Sharing
The AC oversees sharing study resources with external investigators, promoting collaborations. Resource transfer agreements are managed through the Data Management & Statistics Core and deposited in NIH-maintained repositories, including NACC, NCRAD, and NIAGADS.
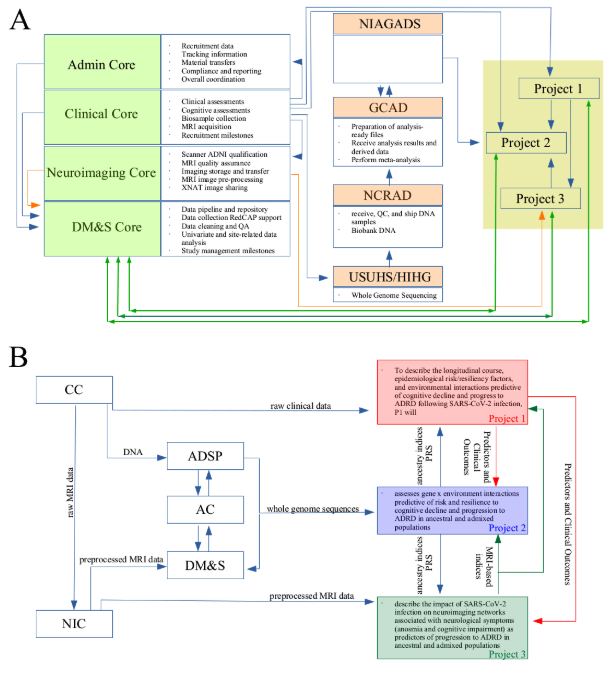
Figure 1. ISAVRAD Program Project Data Flow. Panel B details the shaded area on Panel A.